Three metrics, three thresholds, and a great deal of confusion about what they actually measure and how much they matter. Here is each one, what a passing score is, how to find out which is failing on your site, and the fixes that move each number — which are almost entirely different from one another.
The three, and the thresholds

Advertisement. We earn a commission if you sign up through this link, at no extra cost to you.
Largest Contentful Paint measures when the biggest visible element finishes rendering. Usually a hero image, sometimes a headline. It is the closest thing to “when did the page look ready”.
Good: 2.5 seconds or less. Poor: above 4 seconds.
Cumulative Layout Shift measures how much the page moves around while loading. Not a time — a unitless score combining how much of the viewport shifted and how far.
Good: 0.1 or less. Poor: above 0.25.
Interaction to Next Paint measures the delay between a user interacting and the screen visibly responding, across the whole visit. It replaced First Input Delay in March 2024, and it is a much harder test — FID only measured the first interaction and only the delay before processing started, which let a lot of sluggish pages pass.
Good: 200 milliseconds or less. Poor: above 500.
You need to pass all three to pass overall, and the measurement is taken at the 75th percentile of real visits. That last detail matters more than people realize: it means a quarter of your visitors can have a worse experience than your reported score, and it means one slow template can fail the whole assessment.
What is not a Core Web Vital
Time to First Byte is not one, despite being discussed as though it were. Neither is First Contentful Paint, Total Blocking Time, or Speed Index.
These are diagnostic metrics. They do not count toward the assessment, and they are enormously useful for working out why a real vital is failing. TTFB under 800 milliseconds is the target, and a slow TTFB makes a good LCP arithmetically impossible — if the server takes two seconds to answer, nothing can render before then.
Mobile usability is likewise not a vital, though it sits in the same conversation. Google has indexed mobile-first since 2023, so a page that is unusable on a phone has a problem that no metric here will capture.
How much do they actually matter for rankings?
Worth being straight about this, because both the hype and the backlash overshoot.
Core Web Vitals are a ranking signal. They are a small one. Google has repeatedly described page experience as a tiebreaker between results of comparable relevance — it will not lift a weak page above a strong one, and no amount of optimization compensates for content nobody wants.
The conversion argument is stronger than the ranking argument and gets less attention. A page that renders in 1.5 seconds converts better than the same page at 4 seconds, regardless of where either ranks. That is the reason to do this work.
Field data versus lab data
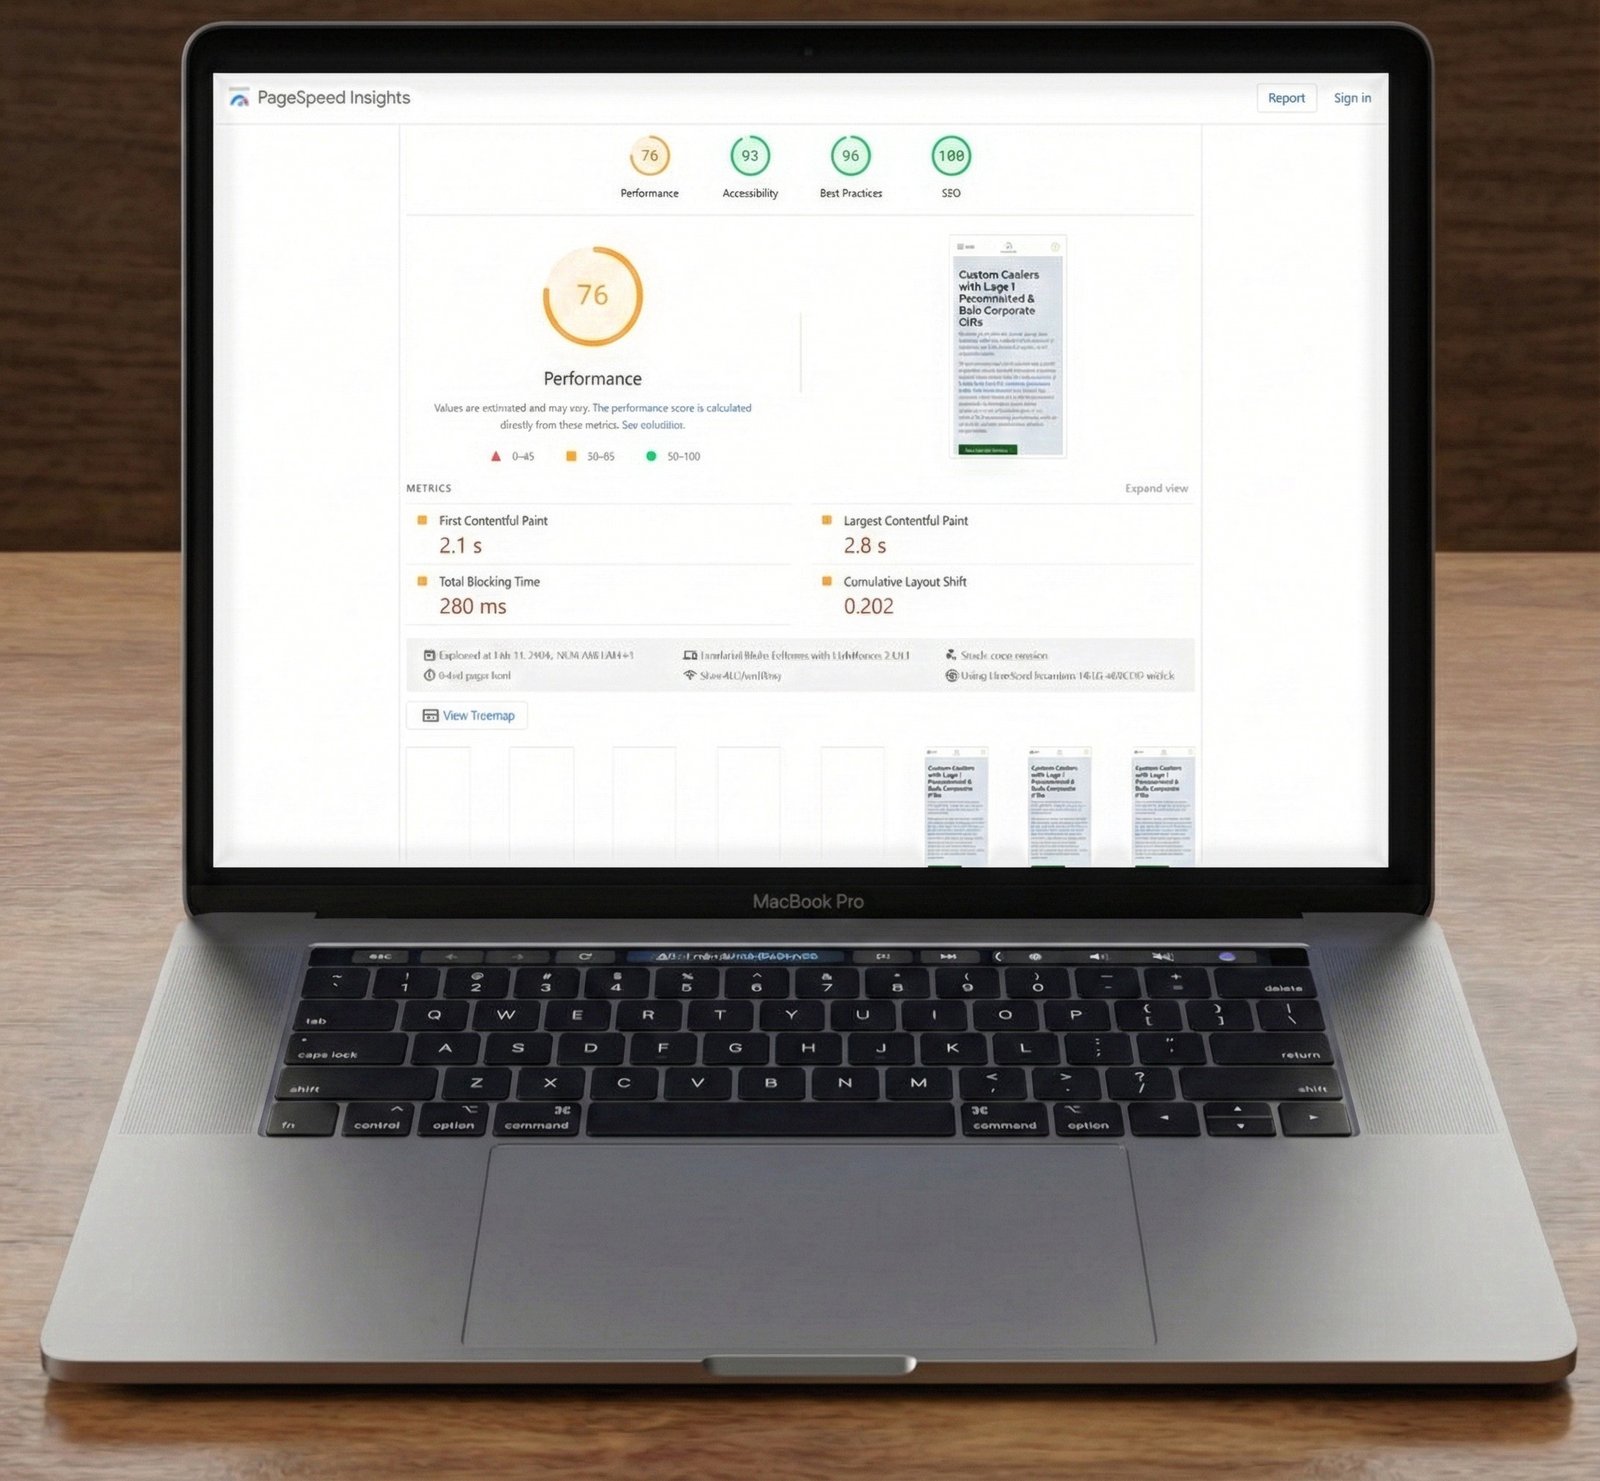
This distinction resolves the most common confusion in the whole subject: “PageSpeed Insights says 95, so why am I failing Core Web Vitals?”
Lab data comes from Lighthouse — one simulated load, on a simulated device, on a simulated connection. Reproducible, immediate, and not what Google uses for ranking.
Field data comes from the Chrome User Experience Report: actual Chrome users, on their actual devices and connections, aggregated over a rolling 28 days. This is what Google uses.
Which explains both halves of the confusion. A perfect lab score with failing field data means real users are on worse hardware and slower networks than the simulation — very common. And a fix you deploy today will not show up in field data for weeks, because the 28-day window has to roll past.
Field data also requires enough traffic to be statistically meaningful. A low-traffic site may have no CrUX data at all, in which case lab data is all you have, and you are optimizing on inference.
Finding out what is failing
Search Console, Core Web Vitals report. Start here. It groups your URLs by the pattern that is failing, which turns a hundred individual problems into two or three template-level ones. Fixing a template fixes every page using it.
PageSpeed Insights. Both data types for a single URL, with field data at the top and lab diagnostics below. The most valuable single line is the LCP element it identifies — often not what you expected.
Chrome DevTools, Performance panel. Where you go when you need to know why rather than what. Record a load with CPU and network throttled to something realistic, and the trace shows exactly what blocked what.
The Web Vitals extension. Live readings as you browse your own site, including INP as you click things — which is the only convenient way to feel a bad INP rather than read about it.
Fixing LCP
LCP breaks into four consecutive parts, and knowing which one dominates tells you what to fix.
Time to first byte. Server response. Fixed with caching, better hosting, database optimization, a CDN. If TTFB is 1.5 seconds, nothing else you do to LCP matters much.
Resource load delay — the gap between the page starting and the browser discovering the LCP image. Usually because the image is a CSS background, injected by JavaScript, or buried behind render-blocking resources. Fixed with a preload hint or by moving the image into the HTML.
Resource load duration — downloading the image. Fixed by making it smaller: modern format, proper compression, correct dimensions.
Element render delay — the image has arrived but cannot paint because the main thread is busy or a font has not resolved. Fixed by reducing render-blocking CSS and JavaScript.
In practice, the two changes that fix most LCP problems are: make sure the hero image is not lazy loaded and carries fetchpriority=”high”, and get the server responding faster. Everything else is refinement.
Fixing CLS
CLS has a small number of causes and they are all preventable.
Images without dimensions. Set width and height on every image so the browser reserves space. Still the single largest cause.
Ads, embeds and iframes. Give every slot a fixed container with a known size before anything loads into it.
Web fonts. A fallback font renders, then the web font swaps in with different metrics and the text reflows. Use font-display: swap with a fallback chosen to have similar metrics, preload the font, and consider size-adjust to match them more precisely.
Content injected above existing content. Cookie banners, notification bars, “we use cookies” strips that appear after render and push the page down. Either reserve the space or overlay rather than insert.
Animating the wrong properties. Animating top, left, width or height triggers layout. Animate transform and opacity, which do not.
CLS is the most fixable of the three, and usually the cheapest — most sites can get to a passing score in an afternoon.
Fixing INP
INP is the hardest of the three because it is about JavaScript execution rather than loading, and the fixes are structural.
The cause is nearly always the same: the main thread is busy. Someone clicks, and the browser cannot paint a response because it is executing a long task.
What helps:
Break up long tasks. Anything over 50 milliseconds blocks interaction. Split work into chunks and yield between them, so the browser gets a chance to respond.
Remove third-party scripts you do not need. Chat widgets, heat-mapping, multiple analytics, social embeds — each competes for the same thread. This is usually the biggest available win, and it is a business conversation rather than a technical one.
Defer what is not needed for the first interaction. Load it after the page is interactive, or on demand.
Show feedback immediately. INP measures until the next paint, not until the work finishes. Render the visual response first, then do the work, and the metric reflects the response rather than the computation.
On WordPress specifically, INP problems usually trace to plugin count, heavy page builders, and sliders or carousels running continuous JavaScript. There is no configuration setting for this. It is a question of what the site is made of.
Mobile is the measurement
Google evaluates mobile and desktop separately, and mobile is the one most sites fail, because that is where the real constraints are: slower processors, worse networks, smaller viewports.
So test on mobile by default, throttle to a mid-range device rather than the laptop you are reading this on, and check tap target sizing and viewport configuration while you are there. A desktop-only optimization pass is a pass over the easier half of the problem.
A realistic order of work
- Open the Search Console report and find which vital fails, on which group of URLs.
- Fix CLS first. Cheapest, fastest, most predictable.
- Then LCP, starting with the hero image and TTFB.
- Then INP, starting with an audit of third-party scripts.
- Wait four weeks before judging the result. The field data window has to roll.
The short version
LCP under 2.5 seconds, CLS under 0.1, INP under 200 milliseconds, measured on real visitors at the 75th percentile. Lab scores are for diagnosis; field data is what counts. CLS is easy, LCP is mostly about the hero image and the server, INP is about how much JavaScript you are running. And none of it will rank a page that has nothing to say.
Working through this list on your own site and would rather not? That is what an Expert Web Audit is for.

Advertisement. We earn a commission if you sign up through this link, at no extra cost to you.